Ricardo García Herrera, Professor of Atmospheric Physics at the Complutense University of Madrid, Institute of Geosciences (CSIC-UCM), talks to meteorologist and communicator Isabel Moreno about the various techniques used to measure temperature variations and about the importance of logbooks.
We are now seeing temperatures that we have not experienced for many, many years. But how do we know that?
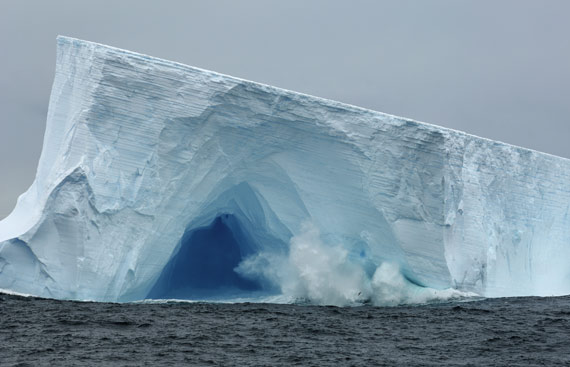
Well, through a variety of techniques. For example, by examining the content of certain oxygen isotopes retrieved from ice cores taken in Greenland or Antarctica, or sometimes by analyzing the characteristics of tree rings of certain species, by looking hard at the sediment found in lakes, or by using documentary sources.
In other words, what we can learn about past climate conditions from various documentary sources.
Such as?
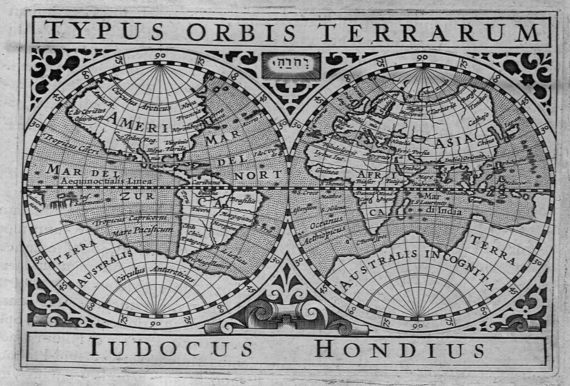
Ship logbooks are the documentary source we have studied the most. Going back to the times of Philip II, Spanish ships crossing the Atlantic were required to fill in a navigation log, describing the main events that they had encountered on route. Upon their return, this logbook would be kept in what is now known as the Archivo General de Indias in Seville (General Archive of the Indies), which at that time was the Escuela de Mareantes (Seafarers’ Academy).
The Chief Cosmographist would talk with the officers and analyze this notebook, as it was used to instruct future mariners. In fact, pretty much all nations that began to sail the Atlantic and the other seas and oceans around the world insisted on the use of a logbook. From the late 17th century, early 18th century onward, these historical records were fairly standard and universal in the information they contained.
They would jot down their position, course, wind speed, and sea and atmospheric conditions, among other things. They also had to indicate any accidents, including injured or sick crew members, any run-ins with enemy vessels, or if they had sighted land anywhere.
We have since been able to use this valuable information regarding wind direction and the strength which they consigned to their logbooks. And we have been conducting climatology studies ever since the 17th century using these valuable records. Around that time, and moving even further ahead to the 18th or 19th centuries, ships were really the only things on Earth capable of seeing what was happening out to sea. Nowadays we have satellites to feed us information about what’s going on everywhere, but back then ships were like floating observatories for us.
Is there any expedition you have a particular fondness for?
Lately we have been studying the Malaspina Expedition. As you know, Malaspina was an Italian explorer in the service of the Bourbons in Spain, who, like other nations of the time, were keen to undertake a scientific exploration around the world. They were ultimately unsuccessful, though they did manage to spend two years plotting out coastlines, mainly in the Americas.
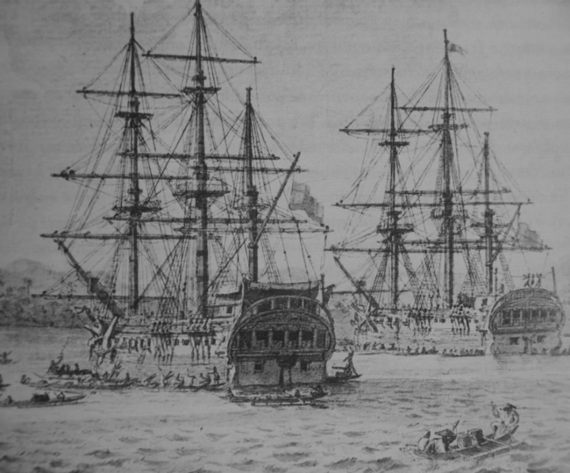
There were no celebrations waiting for Malaspina upon his return. Instead, he found himself locked up and his documents were largely ignored for a long time. We noticed that the meteorological information had yet to be analyzed in detail, and we were able to confirm that the instruments they used, while primitive by today’s standards, yielded some quality data—not far off the quality you would expect today—because they already had thermometers and barometers.
This is something I get asked about a lot, especially when they try to downplay our claims that the temperatures we have now are not comparable to what they were a few centuries ago, and we know why. Many people consider such data to be unreliable. And how do you know that these data are reliable?
There are many very sophisticated techniques, depending on the type of data used. When you dig, or drill, into an ice surface and you take fossil ice that is maybe 200 or 300,000 years old, what you are looking for are oxygen bubbles to see the content of a certain isotope of oxygen, which is an indicator of temperature. However, this calls for a rather statistically complicated chemical process.
What we do is compare the information stored in these archives with current climatology data and look for any discrepancies, gauge whether or not they are explainable, and whether or not there are any biases using different statistical techniques. Each type of technique used to sift through the past has its own forms of calibration and validation.
There are some very interesting things to be found. For instance, the atmosphere goes through what are known as multidecadal cycles, which are very long-term oscillations. For example, we have found that while the West African monsoon in its current phase is causing intense droughts in the Sahel region, 150 years ago it was at the opposite end of the spectrum, with much more abundant rainfall. As a result, living conditions in that part of the world were much better.
So why is this information so interesting? Because what happened 150 years ago had nothing to do with greenhouse gas emissions and this historical information allows us to better characterize natural climate variability. In attribution studies we look to see what part is a natural oscillation and what part is superimposed, meaning essentially the global warming component of the anthropogenic effect.
By better characterizing the past, we can better characterize the present and refine our models. That is the true value of all these observations and hence our need for records dating a long way back. It is not only of historical interest; rather the more information we have from the past, the better able we are to train the models and the more reliable our predictions of the future become.
And last but not least, how exactly do you get your hands on these documents?
It calls for patience and collaboration with other disciplines. It is a joint process we undertake alongside historians, archivists, geographers… We need to draw up a working protocol to ensure that we are all working together with no misunderstandings, and so that we can get in touch should the need arise. For instance, we are currently heading up a European project involving people from the Dutch Meteorological Institute and from various universities in England, Argentina and other countries, and what we saw was that the world, “much to our surprise”, was more global than we thought.
The logbooks all looked much the same. When you think about it, it makes perfect sense, because all those record-keepers would mingle in the same ports so they would inevitably share information and best practices. We often have these multidisciplinary processes where somebody knows what they are looking for and can then work alongside someone else who knows how to find things hidden away in the archives.
All this that you are saying is basically telling us two things: firstly, that it is a broad, cross-cutting process and that we need all branches of knowledge working towards the same goal; and secondly and more importantly, that there are no borders when it comes to climate.
That’s certainly right… climate knows no borders. What might look like a division between the different branches of science is actually see-through, because when you study things like the impact on societies you really need to see society in all its glory and have it in front of you across all the different disciplines.
OpenMind
Comments on this publication